Monday, 27 April 2015

Wednesday, 17 September 2014
It is Here! New Website Announcement | Direction Software Solutions
Direction is pleased to announce the release of our new website,
designed with a fresh new look and user-friendly navigation, updated with the
latest information about our existing and new products
and services.
We invite everyone to visit our site at www.direction.biz, as well as join us on
Facebook (Direction Software Solutions) and comment on our blog https://directionsoftwaresolutions.blogspot.com/
We hope that you will enjoy browsing our new site, finding more options
and information each time, and that it will be yet another tool for
strengthening our business relations.
Your It, Our
Business..
Tuesday, 16 September 2014
Microsoft Dynamics NAV 2015 Windows 8.1 App
There are lot of speculation about New Microsoft Dynamics NAV 2015 release date and it seems that Microsoft has announced in WPC 2014 (happened last weekend) that NAV 2015 (or CRETE) will be launched on October 1, 2014. Surprisingly Microsoft already have released an app on Microsoft Dynamics NAV 2015 for windows 8.1 and the same is available to be downloaded from Microsoft App Store. You can find out more about this app in the below link -
This App will work in both in Windows 8.1 Laptop as well as Tablet. Here is few screen shots of the app for your ready reference -
- Role Center
- Overdue Sales Invoices
- Customer Card
- Sales Invoice
- Sales Invoice Report
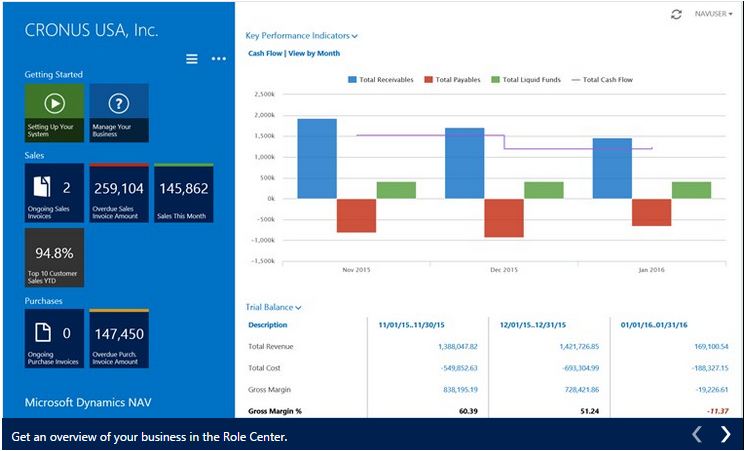
It’s available in English (United States) and 24 other languages. Below is more details from Microsoft App Store about this app -
 Description
With Microsoft Dynamics NAV for modern Windows, you get the familiar Dynamics NAV experience in a fresh and modern interface designed for touch.Dynamics NAV is a business solution from Microsoft that is quick to implement and easy to use, with the power to support your growth ambitions. Dynamics NAV helps businesses manage their financials, supply chain, and people and to create experiences that delight their customers.
Make smart decisions based on the latest business data and get real work done after hours, at home or on the go with Microsoft Dynamics NAV for modern Windows. This is the perfect companion for service engineers, sales field organizations, executives and decision-makers, or anyone in your organization who wants access to Dynamics NAV from a touch enabled mobile device. Get visibility into every angle of your business using the Role Center. Tap to drill into details about your customers, vendors, inventory, or any other data from Dynamics NAV. Quickly create invoices and quotes, and email them with just a few taps.Requires access to Microsoft Dynamics NAV 2015.
Your experience will vary depending on the Dynamics NAV server that you are connected to.
Your experience will vary depending on the Dynamics NAV server that you are connected to.
Features
- Get an overview of your business in the Role Center.
- Tap and swipe to get to your data and drill down into details.
- Search across all columns in a list.
- Send lists to Microsoft Excel or Office 365.
- Shoot pictures using the camera on your mobile device and upload them to Dynamics NAV.
- Rotate your device to get an overview of your data or focus on content.
- Use two apps side by side and see, for example, customer details while you talk via Skype or Lync.
I am eagerly waiting to put my hand on the new Microsoft Dynamics NAV 2015 and start experimenting with features mentioned in the Microsoft Readiness portal and apply them in some real life scenarios 
Written by:
Mr. Snehanshu Mandal is a technologist having more than 11+ years of experience in experimenting and building commercially viable usage of different technology solutions.Presently working as Practice Head - Microsoft Dynamics NAV at Direction Software Solutions, Mumbai, India. He regularly writes at Navision Can Be Fun.
Tuesday, 2 September 2014
How To Use Dimension Combination in Navision?
What is Dimension Combination?
In order to avoid posting entries with contradictory or irrelevant dimensions, you can block or limit specific combinations of two dimensions. A blocked dimension combination means that you cannot post both dimensions on the same entry regardless of what the dimension values are.
A limited dimension combination lets you post both dimensions to the same entry, but only for certain combinations of dimension values.
Where to Use
In an organization, If one cost center (Dimension / Dimension Value) cannot go along with another cost center (Dimension / Dimension Value), you can use the concept of dimension combination of Navision there.
For example, if a company is manufacturing pickles in units in the state of Maharashtra. The Uteran unit of the company does not have the capacity and skill of producing Jack-fruit Pickle. So it is obvious that there will not be any Expenses, Purchase or Production possible on that unit.
Following are the Units and Product Group dimensions:
Units -

Product Groups -

In the above 2 dimensions, to avoid this combination, User can go to Dimension Combination to do the Setup.
Step 1
Go to the Dimension Combination:

Step 2
Open Dimension Combination and filter it for Units & Product Group

Step 3
Click on the button of Product group and Select the option Limited.

If you select the option blocked, then user can not use Productgroup dimension with Units. If you select Limited then User can mention a combination of the dimension from both Productgroup and Units for blocking.

Step 4
Right click on the button and select the drill down option

Step 5
Select the unit ‘Uteran’.

Scroll to the right for selecting Product Group ‘Jackfruit Pickle’

Select the option ‘Blocked’

Now Navision will not allow to post any transaction having combination of Unit = Uteran and Product Group = Jackfruit Pickle

To test the above scenario, we will try to post the data in Item journal for the above combination

While posting the data, Navision will throw a following error / alert

If you select a different combination, Navision will post the data.
Written by:Mr. Abhijit Kadulkar - More than 16 years of experience in Information Technology across multiple technology solutions.Presently working as Delivery Manager- Microsoft Dynamics NAV at Direction Software Solutions, Mumbai, India
Sunday, 17 August 2014
How to Use Chart Components in NAV 2013

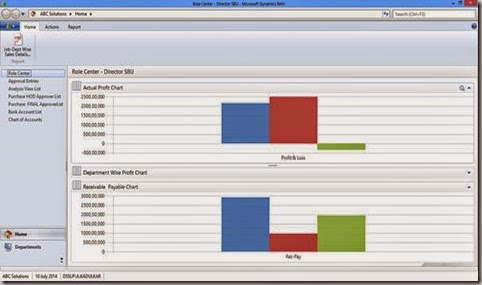
Navision had given a facility to use Chart object. Where a user can drill down and navigate till the document level. We can take one example where user can see the overall profit in a graphical format.
For getting profit we need to create 2 Analysis Views which are updatable.
· Revenue
· Expenses
Note : User must select the proper set of accounts for Revenue and Expenses
Following are the steps to create a Chart
1. Create a Page (Profit Chart) which includes Business Chart Buffer as a source table
Following are the steps to create a Chart
1. Create a Page (Profit Chart) which includes Business Chart Buffer as a source table

2. Select the Field Business Chart

3. Create a separate code unit for Updating and Calling the Chart
4. Following Functions Needs to be created in Code Unit
a. UpdateDataPL – Updating the data for Actual Revenue/Expense Profit
4. Following Functions Needs to be created in Code Unit
a. UpdateDataPL – Updating the data for Actual Revenue/Expense Profit

In the above example Initialize, SetAxis, AddColumn, SetValueByIndex are the functions of Business Chart Buffer Table. A separate Table (In This Case Job Profitablity Setup Table) and Field is used to calculate The Total Revenue and Total Expense as a flow field which is pointed to Revenue & Expense Analysis View entries.
b. DrillDownRevenue – Use this function for Drilling down to The Analysis View Entry Revenue


c. DrillDownExpense – Use this function for Drilling down to The Analysis View Entry Expense

5. All the above functions need to be called from Profit Chart Page.
6. Create a separate Function Called UpdateChart on Page. This function needs to call on OnfindRecord Event on Page.
6. Create a separate Function Called UpdateChart on Page. This function needs to call on OnfindRecord Event on Page.

7. We need to write a code on Datapointclicked event of the page for drill down to the transaction level

8. Now you can attach this page to role centre. Before calling the page please make sure there is a record for user id must be available in the setup table. If the user is not available then please create a user. (In the above scenario Job Profitability Setup table which has been used which is a customized table. Useid,Revenue(FlowField),Expenses (Flowfield) are the three required fields has been taken from that table. Revenue field consist sum amount from the Analysis Entry Table for the Analysis View "Revenue". Expense field consist sum amount from the Analysis Entry Table for the Analysis View "Expenses".)


Written by:Mr. Abhijit Kadulkar - More than 16 years of experience in Information Technology across multiple technology solutions.Presently working as Delivery Manager- Microsoft Dynamics NAV at Direction Software Solutions, Mumbai, India
Monday, 28 July 2014
Prevent Negative Inventory

For many years clients have been asking for the functionality of preventing Negative entry. This has been provided by Microsoft in NAV 2013 R2. (This provision has been given by Microsoft in Inventory Setup).

If the Prevent Negative Inventory setup is marked at Inventory Setup then, Inventory has been checked for all Items.
If the Prevent Negative Inventory setup is not marked at Inventory Setup then, In Item Master there is field called Prevent Negative Inventory needs to be checked. In this scenario, The Inventory will get checked for those Items which are marked with Prevent Negative Inventory

In Standard Navision, I have observed that this Functionality only worked for Sales. But when I tried to post with Item journal and entry type is “Negative Adjt.”. The entry gets posted with negative Inventory. To prevent user from posting negative Inventory, I have done a small change in the function written in Item Ledger Entry Table Called “VerifyOnInventory”
Old Code
IF NOT Open THEN
EXIT;
IF Quantity >= 0 THEN
EXIT;
CASE "Entry Type" OF
"Entry Type"::"Negative Adjmt.","Entry Type"::Consumption,"Entry Type"::"Assembly Consumption":
IF "Source Type" = "Source Type"::Item THEN
ERROR(IsNotOnInventoryErr,"Item No.");
"Entry Type"::Transfer:
ERROR(IsNotOnInventoryErr,"Item No.");
ELSE BEGIN
Item.GET("Item No.");
IF Item.PreventNegativeInventory THEN
ERROR(IsNotOnInventoryErr,"Item No.");
END;
END;
New Code
IF NOT Open THEN
EXIT;
IF Quantity >= 0 THEN
EXIT;
CASE "Entry Type" OF
"Entry Type"::"Negative Adjmt.","Entry Type"::Consumption,"Entry Type"::"Assembly Consumption":
//AK Start
//IF "Source Type" = "Source Type"::Item THEN
// ERROR(IsNotOnInventoryErr,"Item No.");
IF ("Source Type" = "Source Type"::Item) OR ("Source Type" = "Source Type"::" ") THEN
ERROR(IsNotOnInventoryErr,"Item No.");
//AK End
"Entry Type"::Transfer:
ERROR(IsNotOnInventoryErr,"Item No.");
ELSE BEGIN
Item.GET("Item No.");
IF Item.PreventNegativeInventory THEN
ERROR(IsNotOnInventoryErr,"Item No.");
END;
END;
Written by:Mr. Abhijit Kadulkar - More than 16 years of experience in Information Technology across multiple technology solutions.Presently working as Delivery Manager- Microsoft Dynamics NAV at Direction Software Solutions, Mumbai, India
Monday, 21 July 2014
Interactive Reports in NAV 2013 R2–Drill Down
In continuation to my earlier post ‘Interactive Reports in NAV 2013 R2 – Dynamics Sorting’, in this session we will see how we can drill down from the report preview to more detailed data
————————————————————————————————————
You can refer to my earlier post describing interactive sorting in NAV 203 R2 in the following link -
Interactive Reports in NAV 2013 R2
————————————————————————————————————
We will use our existing report designed in my last post [Interactive Reports in NAV 2013 R2] and will incorporate a drill down facility from the ‘Inventory’ column in the report to the Item Ledger Entry corresponding the the report’s item No. Probably the design should be as below -
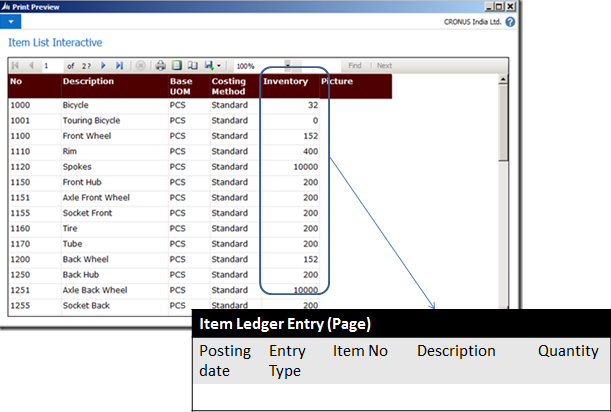
Now to achieve this we need to do 3 things -
- Create a link to ‘Item Ledger entry’ page (Page no 38) and
- Connect the same link with ‘Inventory’ field in the report and
- Enable your report to use an external link (URL)
Create a link to ‘Item Ledger entry’ page:
Creating a link to a page in NAV 2013 R2 is simple. Open any Item Card and drill down from the inventory field -
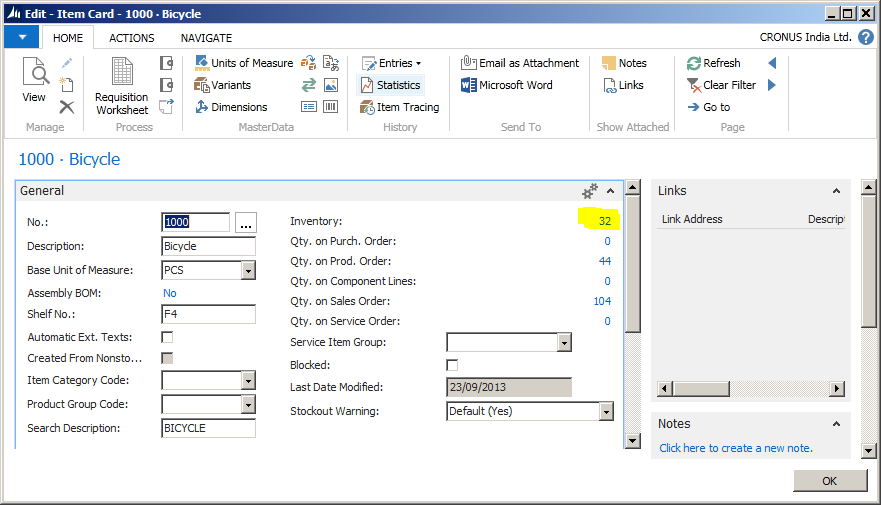
This will open the ‘Item Ledger Entry’ page filtered out by the item from whose card you are drilling down -
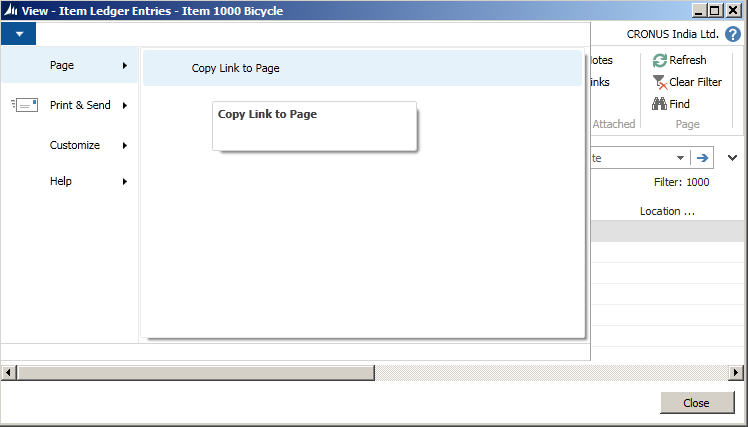
Click on the down arrow key in the upper left corner of the page and go to Page > Copy Link to Page. Open a notepad and paste the link (you need to further edit it)-
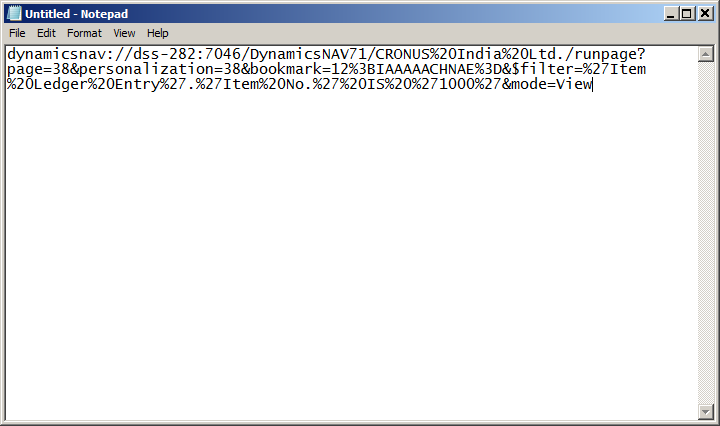
here is the link URL pasted (This link relates to my NAV server and Company):
dynamicsnav://dss282:7046/DynamicsNAV71/CRONUS20India20Ltd./runpagepage=38&personalization=38&bookmark=123BIAAAAACHNAE%3D&$filter=%27Item%20 Ledger%20Entry%27.%27Item%20No.%27%20IS%20%271000%27&mode=View
This link contains lot of information about the target page and some part of this link can easily be removed to make it more generic. This link has the following information -
Link Text
|
Purpose
|
Target Server Instance and port no
| |
/CRONUS%20India%20Ltd.
|
Target Company
|
./runpage?page=38&personalization=38& bookmark=12%3BIAAAAACHNAE%3D&$
|
Target page no 38 and bookmarking
|
filter=%27Item%20 Ledger%20Entry%27.%27Item%20No.%27%20IS%20%271000%27
|
Filer information. Here the data is getting filtered by ‘1000’ on ‘Item No.’ field in target data (Item Ledger Entry)
|
&mode=View
|
Open the page in View mode
|
So I will remove the ‘Target Server’, ‘Port No’, ‘Target Company’ and the ‘Personalisation’ part to make it usable for any server, any database or company (you can port this object to any other database in any other server and it will work fine). post my changes, the link will look like this -
dynamicsnav://///runpage?page=38&filter=’Item Ledger Entry’.’Item No.’ IS ’1000′&mode=View
[I have replaced the %20 with space and %27 with a single quote (‘)]
Right now the above link will open the Page 38 filtering the ‘item ledger entries’ with the Item No. ‘1000’. We need to change it further to make it filter data dynamically with the item no from the report. We will make this change directly in report builder in our next step.
Connect the same link with ‘Inventory’ field in the report:
Open the report in NAV 2013 R2 development environment and go to View > Layout. This will open the report layout in SQL Server Report Builder.
________________________________________________________________
Note: To learn how to use SQL Server Report Builder 3.0 (instead of Visual Studio 2013) for NAV 2013 R2 report layout designing, you can refer to my earlier post NAV 2013 R2 Report layout design with Report Builder
__________________________________________________________________________________________________________
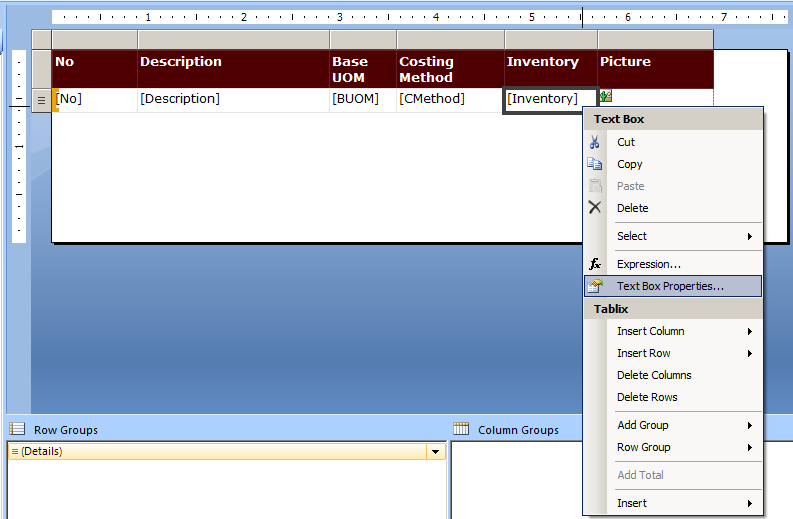
Right click on the ‘Inventory’ textbox and go to ‘Text Box Properties’.
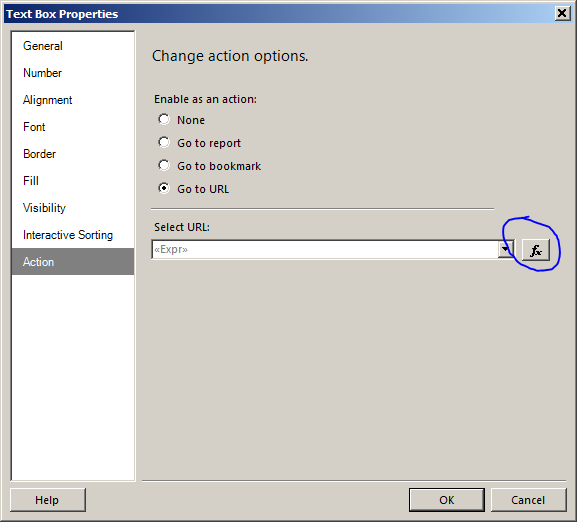
Go to ‘Action’ tab and select the radio button in ‘change action option’ to ‘Go to URL’. After this click on the ‘fx’ (as circled above) button next to ‘Select URL’ text box.
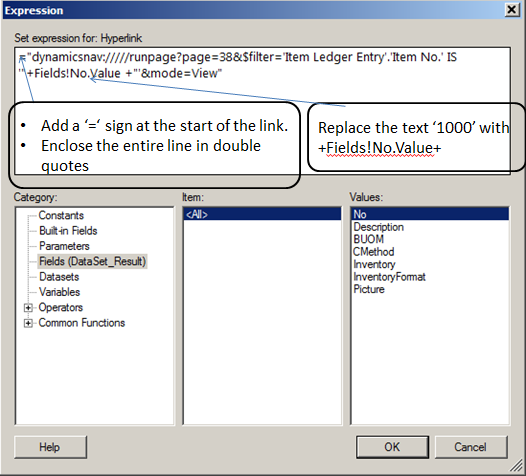
Here I have modified the URL with the following changes:
- Added a ‘=’ sign in front of the URL
- Included the entire URL inside double quotes
- Replaced the text ‘1000’ (the item no) with the text ‘+Fields!No.Value+’. This makes the URL to pick up the Item No. from the value displayed in ‘No.’ field in report.
________________________________________________________________
Instead of manually typing it, you can actually select the ‘Fields (DataSet_Result) in Category box, Select ‘<All>’ in Item box and then double click on ‘No.’ in the Values box.
________________________________________________________________
Post the above changes, my final URL looks like this -
=”dynamicsnav://///runpage?page=38&$filter=’Item Ledger Entry’.’Item No.’ IS ‘”+Fields!No.Value +”‘&mode=View”
Now the field ‘Inventory’ is perfectly linked to the page 38 (Item Ledger Entry). Next let us complete our 3rd step -
Enable your report to use an external link (URL):
Save the report layout and come back to NAV 2013 R2 development environment (Report designer). Go to a blank line at the bottom of the report and click on View > Properties -
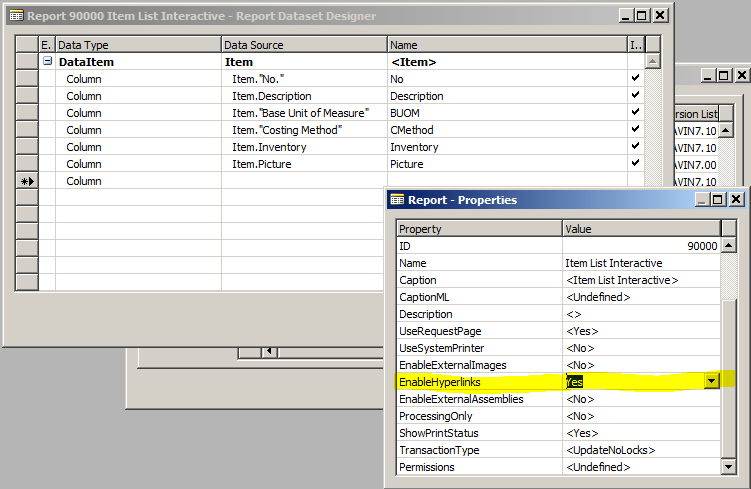
Change the property ‘EnableHyperlinks’ to ‘Yes’.
And that’s it. You are ready with your NAV 2013 R2 interactive report from where you can drill down to more detailed data. Let us test the same.
Save the report and run it from the Object designer itself (that’s the good thing you can do in NAV 2013 R2 but not in NAV 2009  ).
).
).
Once the request page opens, just click on the ‘Preview’ button. This will open the report viewer window. Hover your mouse on the ‘Inventory’ field values and you will see the cursor is getting changed to a ‘hand’ denoting that you can drill down from that value. Click on the value and Item ledger entry page will open up with the entries corresponding to the item no in the report.
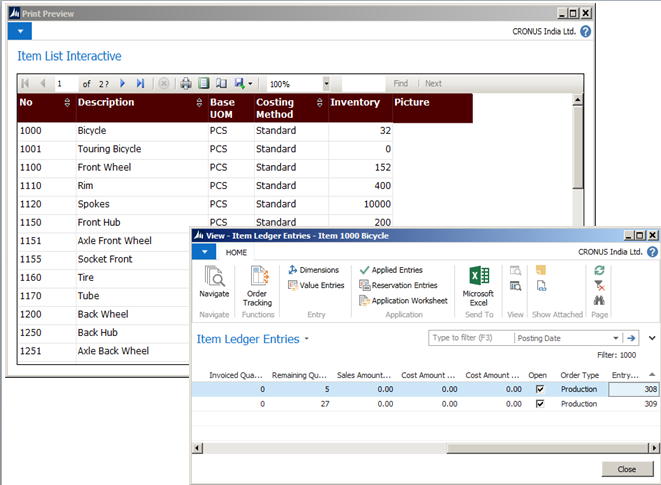
Try and see if all values are opening it’s corresponding item ledger entries only.
Hope you are able to follow the steps mentioned here in creating your own interactive reports. You can leave your comment here in case you face any difficulty or you can write to me on the same.
Catch you in my next post / session on NAV 2013 R2. Till then happy reading.
Written by:
Mr. Snehanshu Mandal is a technologist having more than 11+ years of experience in experimenting and building commercially viable usage of different technology solutions.Presently working as Practice Head - Microsoft Dynamics NAV at Direction Software Solutions, Mumbai, India.
Mr. Snehanshu Mandal is a technologist having more than 11+ years of experience in experimenting and building commercially viable usage of different technology solutions.Presently working as Practice Head - Microsoft Dynamics NAV at Direction Software Solutions, Mumbai, India.
Multiple Active Resultsets (MARS) In NAV 2013

There are a lot of things that have changed from NAV 2009 R2 to NAV 2013. Microsoft Dynamics NAV Server has been re-written by Microsoft to use ADO.dotnet instead of ODBC.
The New interface managed data access layer of Sql Server. Which decreases the consumption of memory. It also makes the 3 box installation very easy by simplifying Sql Server Connection Pooling.
There has been no more one to one connection between NAV client and Sql Server Connection. Previously each connection consumed 40 MB of Memory. Now Memory allocation is in a Managed Manner which is more efficient. For eg If the users are connected to one NAV server Instance where one user reads a record, a second user can read the record from the same cache. This cache is called as Data Cache.
There are 2 types of Data Cache; Global and Private. Global Cache is for all users connected to a Microsoft Dynamics NAV Server instance and Private cache is per user, per company, in a transaction scope. Data in a private cache for a given table and company are flushed when a transaction ends.
(It means, for better performance the memory should be good where the Navision Service Tier lies.)
Microsoft Dynamics NAV 2013 no longer uses server cursors to retrieve records. Now records are retrieved using MARS (Multiple Active Result sets). In NAV 2013 the option for Record Set Property no longer exists.
Written by:
Mr. Abhijit Kadulkar - More than 16 years of experience in Information Technology across multiple technology solutions.Presently working as Delivery Manager- Microsoft Dynamics NAV at Direction Software Solutions, Mumbai, India
How to Handle number of Users and Allotment of time to a particular user in NAV 2013

I have come across one interesting point for handling no of users and the allotment of time to particular user in NAV 2013. Let us take one scenario where the number of user license in NAV is 30, and actual NAV users in the organization are around 48.
Out of these 48 users are divided into 4 departments (Finance, Sales, Purchase & Warehouse). Out of these users, Finance users are continuously connected to the database. Sales users and Purchase users are generally connected in the afternoon. And the warehouse department is generally connected in the evening.
In this case, we can create multiple NST (Navision Service Tier) Department wise. Each NST is attached to a domain and a Port. In active directory services, the system administrator can allot time slots to open a particular port for a particular time for a particular user.
In Navision there is no facility for controlling the time line of users but we can control it through ADS (Active Directory Services) and Firewall.
If you have create multiple NST, it will be very useful both from a Performance perspective as well as from the point of debugging.
Written by:
Mr. Abhijit Kadulkar - More than 16 years of experience in Information Technology across multiple technology solutions.Presently working as Delivery Manager- Microsoft Dynamics NAV at Direction Software Solutions, Mumbai, India
Monday, 23 June 2014
Make the right move from enterprise software sales to an enterprise solution provider

Socrates is considered a great teacher. His method was to ask probing, open ended questions which enabled his audience to understand problems better and agree on his conclusions.
When we go about acquiring new business, try to position yourself as Socrates and the customer as the student. For a successful deal closure eventually the customer needs to be convinced of our solution offering to him.
When we go about acquiring new business, try to position yourself as Socrates and the customer as the student. For a successful deal closure eventually the customer needs to be convinced of our solution offering to him.
It has become a common occurrence to see a customer complaining about enterprise software sales people trying to sell products which don't fit their requirements. Similarly, we frequently hear customers complaining that the implemented product does not meet their requirements.

In the current scenario, product selection poses a tremendous challenge for a customer. His IT team is bombarded with a host of requirements from different business verticals. It's getting increasing difficult for them to evaluate products by themselves and finalize one.
Hence what the customer seeks from the enterprise software provider is to be their IT consulting partner and guide them with right solutions. Customer is not looking for disconnected products, but a set of integrated IT components which coordinate seamlessly in their IT environment.
Hence what the customer seeks from the enterprise software provider is to be their IT consulting partner and guide them with right solutions. Customer is not looking for disconnected products, but a set of integrated IT components which coordinate seamlessly in their IT environment.
Although traditional sales representatives are at a distinct disadvantage in this environment, there are an increasing number of high performers who have understood the shift and embraced the change. They have adopted the following strategies:
- Act as an IT solution partner instead of just selling product.
- Engage with the customer more before outright selling. Understand the customer pain areas in totality and not just restrict to your domain. This helps establish mutual trust.
- Propose a solution road-map to the customer which aligns with customer's short term and long term plans.
- Be receptive of customer feedback and act on it.
Customers these days are smart to understand that a product out of the box is usually not a direct fit. Hence make the right move of changing from a product centric approach to solution provider.
Written by:
Mr. Vivek Iyer- An IT professional having more than 13+ years of experience in experimenting and building commercially viable usage of different technology solutions.Presently working as Practice Head - Microsoft Dynamics CRM at Direction Software Solutions, Mumbai, India.He enjoys traveling and exploring new places.
Thursday, 19 June 2014
Interactive Reports in NAV 2013 R2
With the world cup football 2014 in full swing, I am struggling to catch up up with my goal of weekly post to my blog  . But thought of catching up on the same today.
. But thought of catching up on the same today.
In this edition of post, let me show you some of the interactive features of Microsoft Dynamics NAV 2013 R2 reports
NAV 2013 R2 reports can be pretty interactive in terms of -
- Interactive sorting
- Drilling down to detailed data
- Toggling the visibility of any field [say image] based on user action.
These features are kind of giving more power to end users of NAV to view their reports in their own way. Let them decide how they want to sort the report and help them with details of information wherever possible.
To demonstrate the same, let me create a report in NAV 2013 R2 and take you through these interactive features.
I will create a simple report based on Item Master – ‘Item List Interactive’ with the following columns displayed in the report -
- - No
- - Description
- - Base Unit of Measure
- - Costing Method
- - Inventory and
- - Picture of the item
So I opened the developer environment of NAV 2013 R2, created a new report and inserted the DataItem with the Data Source ‘Item’ table and added the above mentioned columns in the Report Dataset Designer as below -
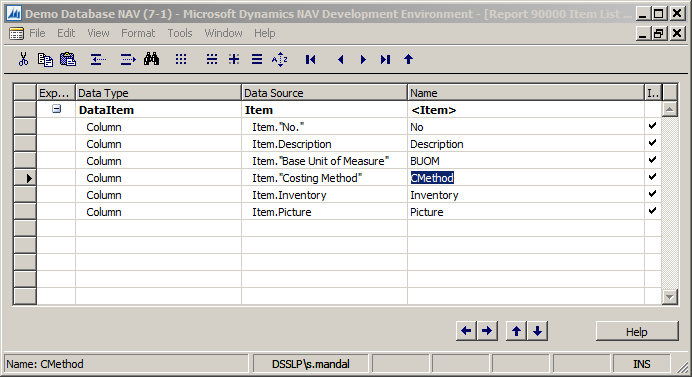
Now let us design the layout of the report. [I am using SQL Server 2012 Report Builder 3.0 for layout Designing]. Go to View > Layout and this will open the Report Builder’s Layout Designer [a blank one]. Just add a table and drag and drop the fields displayed in Dataset_Result under the group Datasets in the Report data pane in the left [You could use a Table Wizard (Insert > Table > Table Wizard) also to include the fields in the layout] -
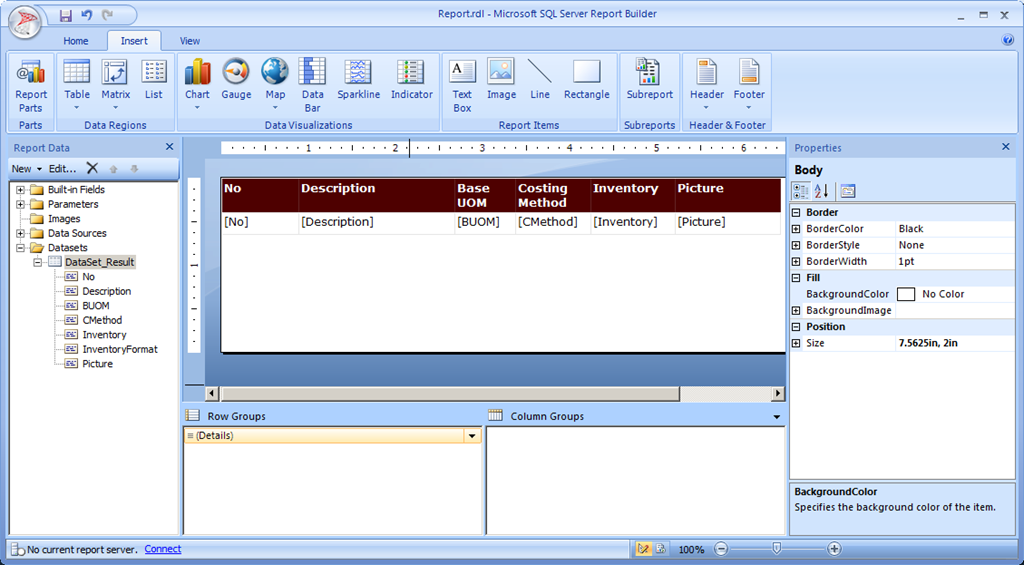
Your layout will look more or less similar to my above screenshot.
————————————————————————————————————————
[Note: Use a image control instead of a textbox control to display the picture field. Otherwise the the picture column will not show the images of the items and will display an ‘Error’ wherever picture is present for the item.]
————————————————————————————————————————
Now your basic report is complete. Close the report builder and save the report and run it from the object designer itself. Though we have not selected any key in the DataItem’s property ‘DataItemTableView’, you will see that the list of items are sorted on [No] column as that’s the primary key of the item table.
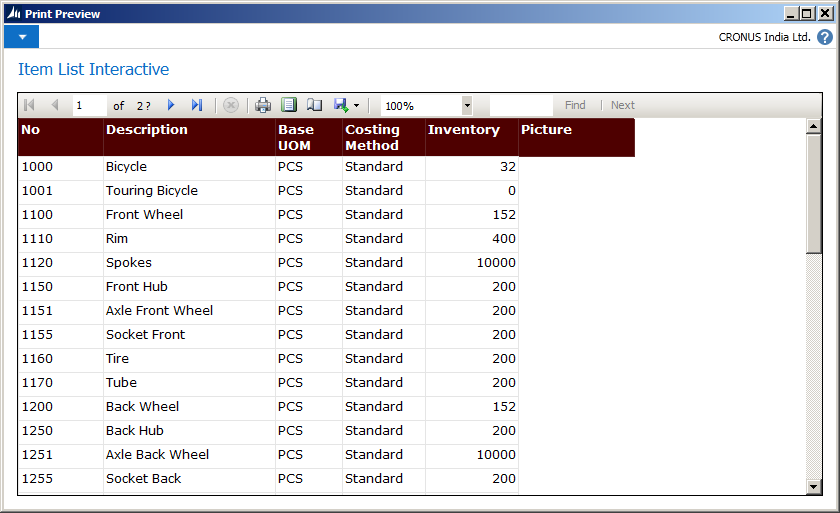
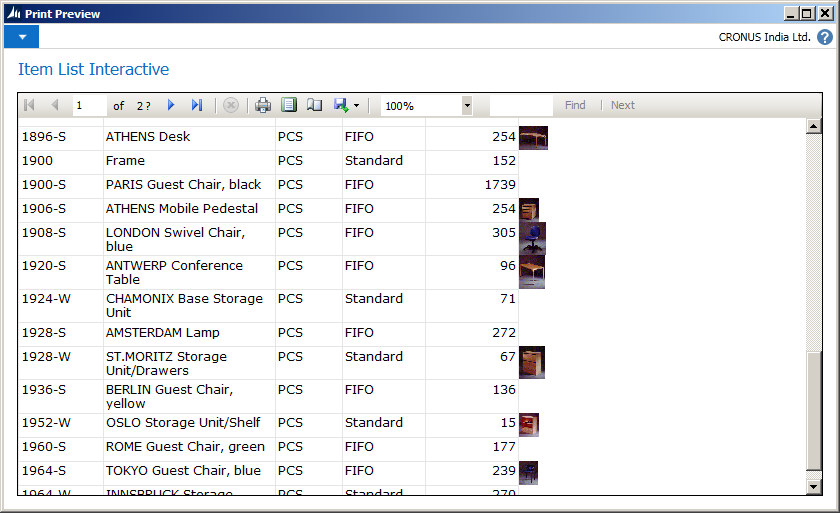
Also, wherever the item has a picture stored in the database, the same will be displayed in the Picture column of the report.
Our next job is to make it more interactive and enable the major columns [Say ‘No’, ‘Description’ and ‘Costing Method’] dynamically sortable during runtime. For that we will go back to our report and open the layout in report builder.
In the layout design, right click on the header textbox of the [No] column and open the text box properties.
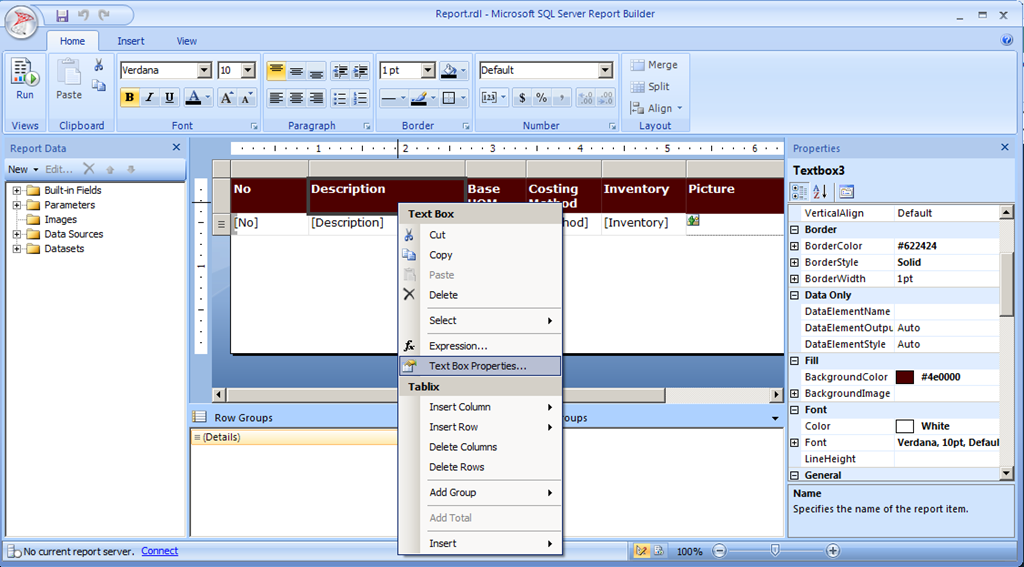
In the properties window, go to the Interactive Sorting tab and in the right hand side pane, tick the [Enable interactive sorting on this text box]
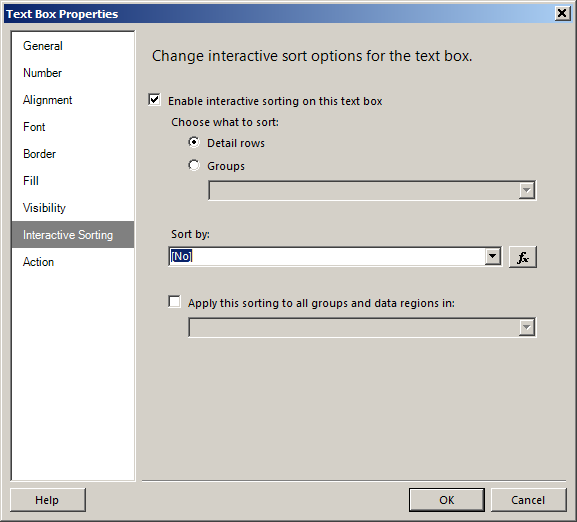
Keep the [Choose what to sort] on [detail row] selected and go to the field [sort by]. Here select [No] column. Click on the ‘Ok’ and you are done with making the [No] column interactively sortable during runtime.
Similarly make the [Description] and [Costing Method] column interactively sortable by repeating the above steps (Right click on the header of the column and open the text box properties. Go to the interactive Sorting tab and tick the [Enable interactive sorting on this text box]. Also select the corresponding field in [sort by]) .
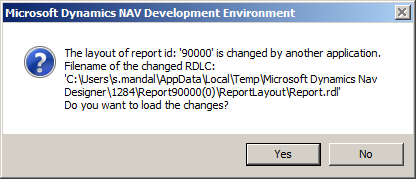
Save the report layout and come out of the Report Builder. In NAV report designer window, click anywhere and it will prompt you to synchronise the report object and the modified RDLC [.rdl] file -
————————————————————————————————————————
[This happens every time you modify anything in the report layout in either Report Builder or Visual Studio and come back to NAV report designer]
[This happens every time you modify anything in the report layout in either Report Builder or Visual Studio and come back to NAV report designer]
————————————————————————————————————————
Say yes and save & compile the report.
Let us test how the report is behaving now after all the above changes. Select the report in Object Designer window and run it. This will open the request page of the report where click on the preview button to display the report -
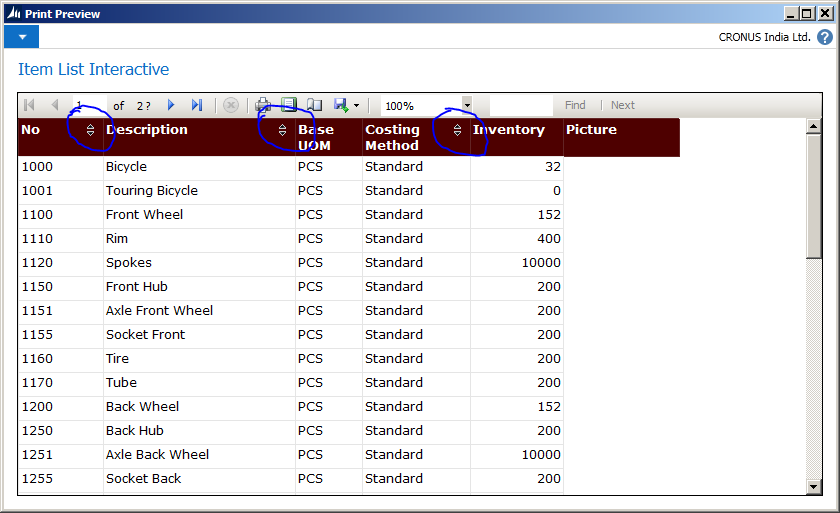
In the preview, immediately you can notice that there are some visual changes in the report and the [No], [Description] and [Costing Method] columns have up/down arrows in their header. This denotes that these columns are enabled with interactive sorting.
Click on the column header of [No] and you will see the sorting of the data is getting changed from ascending to descending and if you click again, the sorting is reverting back to ascending way. The same sorting behaviour you can see for the other 2 columns too ([Description] and [Costing Method]).
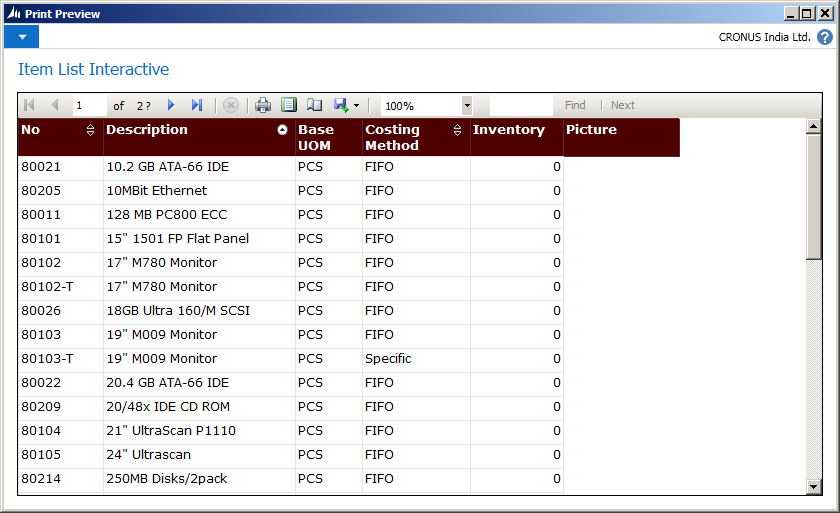
So, we just made our simple ‘Item List Interactive’ report dynamically / interactively sortable on the basis of multiple columns.
That’s closes this session on Interactive features of Microsoft Dynamics NAV 2013 R2 reports. Do send / write to me your feedback on the same. In my next session I will continue with my discussion on rest of the interactive features [Drill down and Image Toggling] of NAV 2013 Report. Till then happy reading and enjoy the Football World Cup matches .
.Written by:
Mr. Snehanshu Mandal is a technologist having more than 11+ years of experience in experimenting and building commercially viable usage of different technology solutions.Presently working as Practice Head - Microsoft Dynamics NAV at Direction Software Solutions, Mumbai, India.
Subscribe to:
Posts (Atom)